2008-01-26

Basing the approach to AGW on good science

The issue of anthropogenic global warming (AGW) has been receiving much attention in the last years. This paper tries to show that most of the coverage of the issue, including the policy recommendations produced to deal with it, has just not been based on good science. It then tries to show what good science IS appearing to offer a safe base for those recommendations.

Plainly stated, science which does not take into account facts that are relevant to the issue under study is bad science. Period.

The usually overlooked fact that is relevant to the issue of AGW comes straight from the temperature record for the last 450 ky as measured from the ice cores drilled at the EPICA Kohnen Station in the Dronning Maud Land (EDML) and at the Vostok Antarctic sites. More recently, the EPICA Dome C (EDC) ice core has provided a record for the last 800 ky. (Unless explicitely stated otherwise, time in the charts goes from right to left.)


Figure 1. Antarctic temperature for the last 450 ky from EPICA and Vostok


The temperatures may be seen in a somewhat greater detail in the following chart for just the Vostok measurements.


Figure 2. Antarctic temperature and CO2 levels for the last 450 ky from Vostok

The following is the nomenclature for [interglacial periods (from present to oldest); warming events respectively leading to them]
Present: [Holocene; Termination 1 (TI)]
1st previous, 120 ky ago: [Eemian or Marine Isotope Stage 5 (MIS 5); Termination 2 (TII)]
2st previous, 240 ky ago: [Marine Isotope Stage 7 (MIS 7); Termination 3 (TIII)]
3st previous, 330 ky ago: [Marine Isotope Stage 9 (MIS 9); Termination 4 (TIV)]
4st previous, 410 ky ago: [Marine Isotope Stage 11 (MIS 11); Termination 5 (TV)]

From this record it is clearly seen that, for the last 450 ky, the Earth has been in a cycle where benign interglacial periods like the Holocene (last 11.5 ky) have been more or less brief spikes occurring every 80-120 ky between much longer cold periods with temperatures around 6 ºC, and as much as 9 ºC, lower than today's.

It is also clear that coolings from tops, although not as steep as warmings from bottoms, are nevertheless quite fast.

Therefore, to evaluate the prospects for the global temperature as far as the natural forcings are concerned, we can start by comparing the Holocene with appropriate previous tops. The first choice would seem to be the Eemian: it is the closest in time and its duration is comparable to that of the Holocene so far. MIS 7 and MIS 9 on the other hand should be discarded because of their extreme sharpness, while MIS 11 looks like another good candidate. We'll later see that, in fact, MIS 11 could indeed be the Holocene's appropriate match.

To compare the Holocene with the Eemian, I made the following graph based on the first in Stuart Staniford's post
"Living in the Eemian". I took the Holocene's last 12 ky and superimposed it onto the corresponding period of the Eemian, 121 ky ago. This is exactly what Stuart did in the second and third graphs of his post, only that here I show it within the bigger picture.


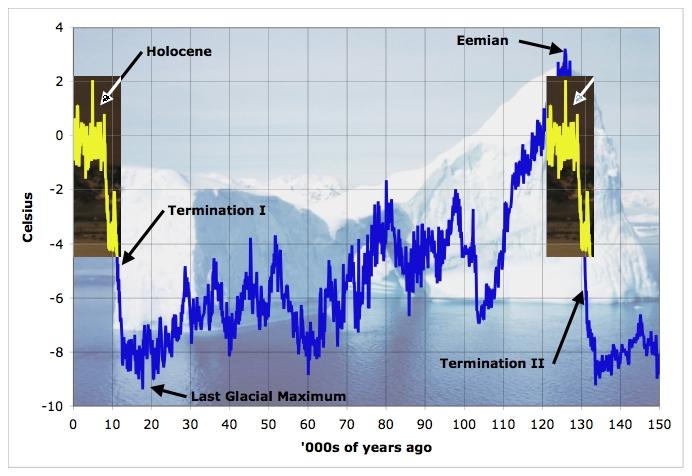
Figure 3. Antarctic temperature for the last 150 ky from Vostok, with the Holocene shifted 121 Ky and superimposed onto the Eemian

From that chart it is clear that, as far as the natural forcings driving climate change are concerned, and IF those forcings had now the same values as they had in the Eemian, the Earth's temperature would start to drop very soon (in about 3 ky) and be 6 ºC lower than today's in about 15 ky.

It should be noted at this point that the cited Stuart's post of 2006 was about the risk of the global temperature (and sea level) reaching the Eemian's peak values, which for the sea level was 5 (five) meters higher than today's. Here we are focusing on the risk of the global temperature (and sea level) plunging as they did after the end of the Eemian, which for the sea level meant a drop of 50 (fifty) meters in 10 Ky, as from the following chart:


Figure 4. Sea levels for the last 140 ky

This possibility in principle could be viewed as actually good: a sea level drop could mean more arable land to compensate for that lost to advancing ice and colder temperatures. However, a new ice age could bring about yet another problem: drought. Quoting from http://en.wikipedia.org/wiki/Last_Glacial_Maximum

"In warmer regions of the world, climates at the Last Glacial Maximum were cooler and almost everywhere drier. In extreme cases, such as South Australia and the Sahel, rainfall could be diminished by up to ninety percent from present, with floras diminished to almost the same degree as in glaciated areas of Europe and North America. Even in less affected regions, rainforest cover was greatly diminished, especially in West Africa where a few refugia were surrounded by tropical grassland.
...
Most of the world's deserts expanded. ... In Australia, shifting sand dunes covered half the continent, whilst the Chaco and Pampas in South America became similarly dry. Present-day subtropical regions also lost most of their forest cover, notably in eastern Australia, the Atlantic Forest of Brazil, and southern China, where open woodland became dominant due to drier conditions. In northern China - unglaciated despite its cold climate - a mixture of grassland and tundra prevailed, and even here, the northern limit of tree growth was at least twenty degrees further south than today."


The quoted Wiki page cites as reference the studies listed at the Paleoclimate Modelling Intercomparison Project page http://pmip.lsce.ipsl.fr/publications/pub21k.shtml . However, there is the possibility that the Wiki page authors' work strayed from the findings of the referenced studies. And since most of them require a journal subscription for access, I could only have a look at The Paleoclimate Modeling Intercomparison Project, S. Joussaume and K. E. Taylor, proceedings of the third PMIP workshop, Canada, 4-8 october 1999, in WCRP-111, WMO/TD-1007, edited by P. Braconnot, 9-24, 2000.

"According to both sets of PMIP simulations the LGM (Last Glacial Maximum) climate is also more arid over most of the northern continents and in the tropics (Figure 7). Larger precipitation however occurs over tropical oceans, especially over the warmer pools of CLIMAP SSTs. Much smaller changes are found over tropical oceans when computing SSTs since the models simulate colder ocean temperatures than CLIMAP. At the regional scale, the simulations are characterised by a number of common features, including a reduction in the strength of the Afro-Asian monsoon (Braconnot, et al., subm.) and increased intertropical aridity, corroborated by various paleoindicators."


To note, this description of global climate and vegetation is about the Last Glacial Maximum, i.e. the coldest period immediately preceding TI. Now, how can we be sure that the "First Glacial Maximum" after an interglacial period does not share the same features?

And finally, it could be argued that, should the Holocene show signs of ending, the time for mankind to plan and prepare for it would be orders or magnitude greater than that allowed by AGW. Not so, according to this 2006 study: http://www.pnas.org/cgi/content/abstract/104/2/450

Evidence for last interglacial chronology and environmental change from Southern Europe

"Establishing phase relationships between earth-system components during periods of rapid global change is vital to understanding the underlying processes. It requires records of each component with independent and accurate chronologies. Until now, no continental record extending from the present to the penultimate glacial had such a chronology to our knowledge. Here, we present such a record from the annually laminated sediments of Lago Grande di Monticchio, southern Italy. Using this record we determine the duration (17.70 ± 0.20 ka) and age of onset (127.20 ± 1.60 ka B.P.) of the last interglacial, as reflected by terrestrial ecosystems. This record also reveals that the transitions at the beginning and end of the interglacial spanned only 100 and 150 years, respectively."


Therefore, if there were not anthropogenic warming forcings in play, the possibility that natural cooling forcings would bring the Earth into a new ice age within a few millenia cannot be discarded a priori. And since that outcome could set in fast and be most disruptive to civilization, it must be explicitely considered and discarded (or accepted as lesser evil) as part of any scientific study of AGW from which policy recommendations are to be derived.

Plainly stated, any scientific approach to the issue of AGW, particularly with the aim of offering policy recommendations based on it, which does not take into account the temperature record for at least the last 450 ky is bad science. Period.


The recent position statement from the American Geophysical Union is a fine example thereof:

"During recent millennia of relatively stable climate, civilization became established and populations have grown rapidly."

Sure folks, but the record for the last 450 millennia shows that periods like this of benign, stable climate have a length of just a few millenia, and that they are always followed by plunges into much longer ice ages. So prolonging the climate of the recent millenia for much longer may not be an option in the system design specifications, in which case either we do our best to break out of the cycle into a warmer period or we plunge into a new ice age soon.

"In the next 50 years, even the lower limit of impending climate change—an additional global mean warming of 1°C above the last decade—is far beyond the range of climate variability experienced during the past thousand years and poses global problems in planning for and adapting to it."

So, should we do our best to stay within the range of the past thousand years while hoping that the natural forcings will not push us down the slope this time? And if they do, would planning for and adapting to a new ice age pose no global problems?

"Warming greater than 2°C above 19th century levels is projected to be disruptive, reducing global agricultural productivity, causing widespread loss of biodiversity, and—if sustained over centuries—melting much of the Greenland ice sheet with ensuing rise in sea level of several meters."

So, should we opt for the risk of cooling greater than 6ºC instead? Because that path may be way more disruptive and ruinous for global agricultural productivity. Unless you are betting on the ensuing sea level drop of more than 50 meters to solve all those problems.

In contrast, the following position statements (if real, of course) would be examples of good science and sound recommendations:

A. "After having achieved a complete understanding of the natural forcings driving climate change, we have unequivocally determined that, purely out of them, the current interglacial period will have a total duration of around HH Ky - i.e. it will span a further FF Ky into the future - and that, as a result, mankind can safely embark on an aggressive reduction of CO2 emissions without fearing that the onset of a new ice age could take place in the next millenia."
or
B. "After having achieved a complete understanding of the natural and anthropogenic forcings driving climate change, and an accurate quantitative assessment of their relative weight, we have unequivocally determined that, if CO2 emissions are reduced according to the KKK protocol, the anthropogenic warming forcings will exactly compensate for the natural cooling forcings and the Earth will remain in the Holocene for ever after."
or
C. "After having achieved a complete understanding of the potential consequences of global warming versus those of the onset of a new ice age, we see unequivocally that the latter would be much more bearable for mankind. Therefore, we recommend an aggressive reduction of CO2 emissions while stocking up on sweaters."


I will next look at where current scientific knowledge stands relative to the possibility of issuing statements A. or B. above. (I don't think they will dare to state C.!) To that purpose, I will use as reference the reading materials used by Dr Ian Lawson in his 2007-2008 Palaeoclimate course at the University of Leeds, together with his comments on them.

Starting with hypothetical statement B., it is common knowledge that the natural forcings driving climate change are related to the periodical changes in the Earth's orbit around the Sun, collectively known as Milankovitch cycles, of which there are three with their respective periods:

Eccentricity (orbital shape): 413 ky for major component (eccent. variation ±0.012) (*)
Obliquity (axial tilt): 41 ky
Precession (wobble): 23 ky (actually 21-26)

(*) A number of other terms vary between 95 ky and 136 ky, and loosely combine into a 100 ky cycle (variation of −0.03 to +0.02).

Dr Lawson's comments on this subject should be taken seriously...

"Milankovitch is a very complex subject area – Huybers and Wunsch (2005) (*) estimate that there are more than 30 competing hypotheses to explain the relationship between orbital variations and climate! Use the reading materials below to consolidate and broaden your understanding of the topic, but bear in mind that you will only be examined on the subjects discussed in the lecture – the trick here will be to avoid getting bogged down in the complexities of the arguments."

(*)
"Obliquity pacing of the late Pleistocene glacial terminations"


... and should lead us to think that scientific knowledge is still far from the point of being able to make an accurate quantitative assessment of the combined effect of natural and anthropogenic forcings that would enable the issuance of statement B.

That leaves us with statement A. Therefore, either science can determine that, purely out of the natural forcings, the Holocene will be much longer than the Eemian (the "Long Holocene" hypothesis), in which case it makes sense to embark on a policy of aggressive reduction of CO2 emissions, or we are left with the possibility that the Holocene, out of the natural forcings, could be just as wide as the Eemian (the "Short Holocene" hypothesis), in which case the outcome of such a policy might turn out to be a new ice age with a substantially lower sea level, an ice-covered North America, and drier climate everywhere. And at a time when there will be no fossil fuels to keep people warm.


The foremost proponents of the "Long Holocene" hypothesis are A. Berger and M. F. Loutre, researchers at the Institut d'astronomie et de géophysique Georges Lemaître, Université catholique de Louvain. They suggested that an orbital analogy could be made between the Holocene and MIS 11. This analogy results from a similar low level of eccentricity (the distance between MIS 11 and today corresponds to the 413 ky period in eccentricity). Notably, their first paper on the subject "Marine Isotope Stage 11 as an analogue for the present interglacial" was received by the Global and Planetary Change journal in 1999 but accepted only in 2002. The comparison was further strengthened by simulations conducted with a two dimensional climate model (the "Louvain-la-Neuve" or LLN model). Such simulations suggested that the orbital forcing would not be triggering a glacial inception until 50 ka after present. Their results were published in the 2003 paper "Clues from MIS 11 to predict the future climate – a modelling point of view" whose abstract says:

"Simulations performed with the LLN two-dimensional Northern Hemisphere climate model have confirmed that climate is largely triggered by changes in insolation forcing although atmospheric CO2 concentration also plays an important role, in particular in the amplitude of the simulated variations. Marine isotope stage 11 (MIS 11) some 400 kyr ago and the future share a common feature related to climate forcing, i.e. the insolation at these times displays small similar variations. MIS 11 can be considered an analogue for future natural climate changes. Different simulations were performed to identify the conditions constraining the length of the MIS 11 simulated interglacial. Clearly its length strongly depends on the phase relationship between insolation and CO2 variations. It is only when insolation and CO2 act together towards a cooling, i.e. they both decrease together, that the climate enters quickly into glaciation and that the interglacial may be short. Otherwise each forcing alone is not able to drive the system into glaciation and the climate remains in an interglacial state. The same situation applies for the future. However, we already know that CO2 and insolation do not play together. Indeed, insolation has been decreasing since 11 kyr BP and CO2 concentration remains above 260 ppmv, with a general increasing trend over the last 8000 yr. Therefore we conclude that the long interglacial simulated for the future is a robust feature and the Earth will not enter naturally into glaciation before 50 kyr AP."


On the other hand, the foremost proponent of the "Short Holocene" hypothesis is William F. Ruddiman. His hypothesis is actually more radical than mine. Let's recall that, from the chart in Figure 3, I had raised the possibility that as far as the natural forcings driving climate change are concerned, and IF those forcings had now the same values as they had in the Eemian, the Earth's temperature would start to drop very soon (in about 3 ky) and be 6 ºC lower than today's in about 15 ky. In contrast, what Ruddiman postulated in his 2003 paper "The Anthropogenic Greenhouse Era Began Thousands of Years Ago" was:

The anthropogenic era is generally thought to have begun 150 to 200 years ago, when the industrial revolution began producing CO2 and CH4 at rates sufficient to alter their compositions in the atmosphere. A different hypothesis is posed here: anthropogenic emissions of these gases first altered atmospheric concentrations thousands of years ago. This hypothesis is based on three arguments. (1) Cyclic variations in CO2 and CH4 driven by Earth-orbital changes during the last 350,000 years predict decreases throughout the Holocene, but the CO2 trend began an anomalous increase 8000 years ago, and the CH4 trend did so 5000 years ago. (2) Published explanations for these mid- to late-Holocene gas increases based on natural forcing can be rejected based on paleoclimatic evidence. (3) A wide array of archeological, cultural, historical and geologic evidence points to viable explanations tied to anthropogenic changes resulting from early agriculture in Eurasia, including the start of forest clearance by 8000 years ago and of rice irrigation by 5000 years ago. In recent millennia, the estimated warming caused by these early gas emissions reached a global-mean value of 10 ppm in the last 1000 years are too large to be explained by external (solar-volcanic) forcing, but they can be explained by outbreaks of bubonic plague that caused historically documented farm abandonment in western Eurasia. Forest regrowth on abandoned farms sequestered enough carbon to account for the observed CO2 decreases. Plague-driven CO2 changes were also a significant causal factor in temperature changes during the Little Ice Age (1300–1900 AD)."


A year later, using simulations with the "GENESIS 2" model, in a co-authored paper "A Test of the Overdue-Glaciation Hypothesis" (2MB PDF) Ruddiman et al reached the conclusion that, were it not for pre-industrial anthropogenic GHG emissions, global temperature today would already be 2ºC cooler. In their words:

"The ~2ºC mean-annual cooling simulated by removing anthropogenic greeenhouse gases is equivalent to roughly one third of the global-mean difference between full-interglacial and full-glacial climates. It also represents 80% of the warming simulated by the GENESIS 2 model in response to a doubling of modern CO2 (Thompson and Pollard, 1997). Without any anthropogenic warming, Earth’s climate would no longer be in a full-interglacial state but well on its way toward the colder temperatures typical of glaciations."


Interestingly, Ruddiman addressed the "Long Holocene like MIS 11" hypothesis in 2004 in "Cold climate during the closest Stage 11 analog to recent Millennia". Even more interestingly, Crucifix, Loutre and Berger published also in 2004 a Commentary on “The Anthropogenic Greenhouse Era Began Thousands of Years Ago” stating:

"We think that the only way to resolve this conflict is to properly assimilate the palæoclimate information in numerical climate models. As a general rule, models are insufficiently tested with respect to the wide range of climate situations that succeeded during the Pleistocene. In this comment, we present three definitions of palæoclimate information assimilation with relevant examples. We also present original results with the Louvain-la-Neuve climate-ice sheet model suggesting that if, indeed, the Holocene atmospheric CO2 increase is anthropogenic, a late Holocene glacial inception is plausible, but not certain, depending on the exact time evolution of the atmospheric CO2 concentration during this period."


Keeping in mind that these are the foremost proponents of the "Long Holocene" hypothesis, let's pay attention to the emphasized sentence: a delayed onset of the new ice age "is plausible, but not certain, depending on the exact time evolution of the atmospheric CO2 concentration"! (But fear not, for all the wise people currently advocating for drastic cuts in CO2 emissions are certainly aware of the full contents of this and subsequents studies from these researchers, and they have made sure that their recommended policies still allow for ample margin to avoid an early Holocene glacial inception.)

BTW, this is in line with Ruddiman's comment in
a Dec 2005 archived discussion: "the fact that Berger’s model produced an extremely long interglaciation if he only used insolation forcing, but a much shorter one if he added CO2 (from Vostok) to the forcing;"

Moreover, the three Belgian researchers published in 2006
"The Climate Response to the Astronomical Forcing" stating:

"The Louvain-la-Neuve climate-ice sheet model has been an important instrument for confirming the relevance of Milankovitch’s theory, but it also evidences the critical role played by greenhouse gases during periods of low eccentricity." (And the Holocene is such a period.)


Therefore, two years ago the struggle between the two hipotheses was still unsettled. Looking now to other researchers for guidance, in Jul 2006 Peter Huybers published the potentially breakthrough paper "Early Pleistocene Glacial Cycles and the Integrated Summer Insolation Forcing" in which he states:

"Long-term variations in Northern Hemisphere summer insolation are generally thought to control glaciation. But the intensity of summer insolation is primarily controlled by 20,000-year cycles in the precession of the equinoxes, whereas early Pleistocene glacial cycles occur at 40,000-year intervals, matching the period of changes in Earth's obliquity. The resolution of this 40,000-year problem is that glaciers are sensitive to insolation integrated over the duration of the summer. The integrated summer insolation is primarily controlled by obliquity and not precession because, by Kepler's second law, the duration of the summer is inversely proportional to Earth's distance from the Sun."


After which a numerous research team, using the EPICA Dome C measurements and the "ECBILT-CLIO" intermediate complexity climate model, in their Oct 2006 paper "Past temperature reconstructions from deep ice cores: relevance for future climate change" reviewed both Ruddiman's and Berger's hypotheses, and building on the just cited Huybers papers, concluded:

We propose that, when the eccentricity is small and therefore the precession minima and maxima are weak, the role of obliquity cannot be neglected in triggering deglaciations and glaciations. In this respect, it is important to see that there is no perfect orbital analog for the presentday and future orbital context (Berger et al., 1998). Today, the obliquity is at an intermediate value, whereas the end of MIS11 occurred when both the summer insolation and the obliquity were minimal. If obliquity is playing a larger than invoked role on ice ages, then it cannot be expected that an ice age would be to occur over the next 50 ka, until minima of obliquity and NH summer insolation coincide.
...
This analysis should be extended by taking into account the obliquity imprint on climate feedbacks such as the atmospheric dust and greenhouse gas content,"


While the conclusions of this study heavily lean towards the "Long Holocene out of just natural forcings" hypothesis, a 2005 study on a completely different area yielded results supporting Ruddiman's case: "Similarity of vegetation dynamics during interglacial periods" Analysing polen records, the authors found that the pattern of relative variation of different bioclimatic affinity groups (BAGs) in the modern records corresponded to that seen at the end of previous interglacials, and they ask:

"Does the pattern we observe in the uppermost part of the Velay pollen record indicate the end of the Holocene interglacial as it was seen in the previous interglacials? If not, then the Holocene would be a unique interglacial period during which either a reexpansion of BAGs 12 and/or 10 would take place or the coniferous forests would persist at the temperate latitude for several thousand years until the onset of the next ‘‘natural’’ interglacial period. Such a situation has not been observed during the prior four interglacials."


To sum up, advancing scientific knowledge seems, by the end of 2006 to have shifted the balance towards the "Long Holocene" hypothesis, although it is still far from reaching a firm consensus. Which leaves the treatment and policy recommendations on the subject of AGW issued before that date looking rather reckless, to say the least.

As for how far science still is from a firm consensus,
a newly published paper by Raymo and Huybers is most eloquent:

"It is widely accepted that variations in Earth's orbit affect glaciation, but a better and more detailed understanding of this process is needed. How can the 41,000-year glacial cycles of the early Pleistocene be explained, let alone the 100,000-year glacial cycles of the late Pleistocene? How do the subtle changes in insolation relate to the massive changes in climate known as glacial cycles? And what are proxy climate records actually measuring? The field now faces these important questions, which are made all the more pressing as the fate of Earth's climate is inexorably tied to the vestige of Northern Hemisphere glaciation that sits atop Greenland, and to its uncertain counterpart to the south."

2008-01-14

On the Global Risks 2008 Report for Davos

The approach taken by the Global Risks 2008 Report for the Davos World Economic Forum is a cause for both hope and concern. On the one hand, it is auspicious to see that it includes the world's two most critical and urgent issues, food and energy security, among the four main global risks. But on the other hand the Report fails to assign those issues their real degree of severity, and perhaps more importantly, it does not seem to understand the real dynamics driving them.

To start with, the Report assertion that, of the four issues, "systemic financial risk is the most immediate and, from the point of view of economic cost, the most severe", either has to be construed as revealing a serious lack of understanding of the immediacy and severity of the problems affecting the food supply, or else must be qualified as outrageous. Because the consequences of a systemic financial crisis, however severe, cannot be compared to the starvation of millions.

Notably, the Report states clearly - and correctly - that the growing use of food crops for biofuel production is a key driver of the increasing risk to food security. But although it initially states that "the consequences, particularly for the most vulnerable communities, may be harsh", it ends the treatment of the subject stating that "the consequences of all these trends for perpetuating the escalation of food prices are difficult to predict." Actually, the consequences are not so difficult to predict if the analysis is ultimately focused on food production levels rather than prices, because global food production is a direct determinant of the population level that can be sustained. I.e., if food production drops because of increased biofuel production, it will have as a direct consequence that fewer people will be able to obtain adequate nutrition. And to evaluate the potential share of global food production that could eventually be diverted to biofuels, and the timing for that, it is essential to correctly understand the dynamics driving the diversion process.

Quite simply, the main driver of the growth in biofuel production is the rise in the crude oil price. As biofuels are a direct replacement for petroleum products, their prices are directly proportional to those of the petroleum products replaced, plus or less differential taxes/subsidies. Therefore, a higher crude oil price increases the profitability of biofuel production while at the same time decreasing the profitability of food production. As a result, arbitraging based on profits per acre starts driving the allocation of agricultural production (and in turn of land) out of food and into biofuels. As more agricultural production (and land) is diverted into biofuels, biofuel production will increase and fuel prices will consequently tend to stabilize, while food production will decrease and food prices will consequently rise, until the profitability of food production becomes once again competitive with that of biofuel production and a new equilibrium state is reached where no further diversion occurs. But it is crucial to note that the food production level at this new equilibrium state is LOWER than that at the original state. (Notably, the Report does mention that "others believe that markets will gradually readjust to shortages as higher prices make it profitable again to grow crops for food". But it fails to mention that the new equilibrium state occurs at a lower food production level.)

Not only is the above dynamics entirely logical, it is also supported by facts as shown in the recently published study "Fermenting the Food Supply - Modelling Biofuel Production as an Infectious Growth on Food Production" by Stuart Staniford, PhD, available at http://www.theoildrum.com/node/2431
.

Once understood that it is the rise in the crude oil price what drives the biofuel boom through a simple profit-based arbitraging mechanism, the next step in order to assess the potential share of global food production that could eventually be diverted to biofuels is to evaluate the prospects for the oil price. Which must be done on both a short- and long-term basis.

For the short term, the current data and projections from both the US Energy Information Administration (EIA) as of Jan. 08, 2008 at http://www.eia.doe.gov/emeu/steo/pub/contents.html
(table 3a) and the OECD International Energy Agency (IEA) as of Dec. 14, 2007 at http://omrpublic.iea.org/currentissues/full.pdf speak quite loudly:

World oil production
year 2005 2006 2007 2008
EIA 84.6 84.6 84.8 87.6 (wishful thinking?)
IEA 84.6 85.4 85.5

World oil consumption
year 2005 2006 2007 2008
EIA 83.7 84.8 85.9 87.5
IEA 83.9 84.7 85.7 87.8

Given the trend in global oil production for 2005-2007, and the fact that both the EIA and the IEA currently project 2008 global demand being respectively 2.7 Mbpd and 2.3 Mpbd higher than 2007 global supply, it is painfully clear that either global oil production breaks decisively from its recent performance and surges in 2008 - which looks improbable at best - or global oil demand will be brought down to convergence with supply, in turn either by a significant recession in the OECD or by an oil price that will surge deep into the triple digits in 2008, in euros as well as in dollars. The last possibility will have a significant short-term impact in global biofuel (and food) production, since, as shown by the cited study, "when oil prices spike up, a year or so later we have a new burst of ethanol capacity under construction (which then comes on stream 1-2 years after that)." And this impact will take place against the background of an already dire situation, as described by the Dec 17, 2007 FAO communique "FAO calls for urgent steps to protect the poor from soaring food prices" at http://www.fao.org/newsroom/en/news/2007/1000733/index.html
.

For the long term, the determinant factor is a constraint from physical reality: the fact that global oil reserves are finite, and that as a result global oil production will eventually reach a peak and then commence a relentless decline. The peaking event is termed "Hubbert's Peak" after the late Shell geologist M. King Hubbert, PhD, who in 1956 predicted that US oil production would peak in 1970 as it effectively did. Today, most analysts without vested interests are predicting global Hubbert's Peak to take place in the 2010-2012 timeframe. Therefore, in the absence of a worldwide voluntary reduction of crude oil demand in line with the future peaking and subsequent decline of crude oil production, the long term prospects for the oil price are of a relentless rise. Which through the profit-based arbitraging mechanism described above will drive the world into successive new equilibrium states with higher biofuel production and lower food production. Obviously the process will eventually stop before 100% of the food gets turned into fuel. The question is, at what point? When we have a bidding war between the gas tanks of the global middle and wealthy classes and the dinner tables of the poor, where does that reach equilibrium?

Regarding global crude oil demand, the current path is the exact opposite of what would be required to prevent a relentless rise of the oil price, as the populations of giant emerging economies, particularly China and India, increasingly adopt the oil consumption patterns of the citizens of OECD nations. For which they obviously cannot be reproached: how could Americans ask the Chinese to keep riding bikes as they drive their SUVs?

To sum up, the prospects for global crude oil production - based on geological constraints -, plus the prospects for crude oil demand - based on human nature-, plus the profit-based arbitraging mechanism for diverting agricultural production into biofuels, all make for a very bleak picture for the global food supply. Indeed, as shown in the cited study, global biofuel production could be consuming half the global food supply within about six or seven years.

Of the three factors powering the process, increasing global crude oil production in the long term is physically beyond the reach of policy-makers (and while it could be increased in the short term, given the finiteness of reserves that would imply a steeper decline later). But acting in a concerted and collaborative way to stop and reverse growth in global oil demand is not. And while the bulk of this growth comes from emerging economies, it is not conceivable to expect it to stop without the developed economies setting the example by drastically reducing their own consumption. As for the food/biofuel arbitraging mechanism, any government-induced price distortion that increases the profitability of biofuel production over that of food production through differential taxes/subsidies directly amounts to hastening the appearance and aggravating the degree of the coming food crunch.

Again, this is not an issue which the world can take years to study: it is already hurting, as per the FAO communique, and the factor that drives it - rising crude oil prices - is poised to surpass its 2007 strong performance in 2008 if a significant OECD recession does not materialize promptly.

And if world leaders decide that - while physically feasible - it is politically impossible to act in a concerted and collaborative way to stop and reverse global oil demand growth, whereby the prospects for world food production will be to decline to a level substantially lower than today's, they must at the very least make those prospects openly and plainly known to everyone. For even if it could be argued that it is politically impossible to prevent the third horseman from coming back - this time driving a biofuel-powered SUV -, there can be no excuse for keeping people ignorant of the fact that he is coming for dinner. For their dinner.

2008-01-08

The biofuels case as the coming of the third horseman

Stuart Staniford has just posted at http://www.theoildrum.com/node/2431 a remarkable piece of work that covers, at an academic level, an issue I have been raising for some time in TOD comments like
http://www.theoildrum.com/node/3412/286090 and
http://www.theoildrum.com/node/3124/253090 . After making a couple of IMV important observations, I will try to express the concepts involved as a simple business case.

First, although current global annual production of ethanol is much higher than that of biodiesel, due to US corn ethanol, biodiesel (mostly from soybean) will probably play an increasingly larger role because of the following reasons:

1. Soybean biodiesel has a much more robust EROEI than corn ethanol.

2. Soybean has lower fertilizer and pesticide requirements than corn, in absolute terms and even more when taking EROEI into account. "Per unit of energy gained, biodiesel requires just 2 percent of the N and 8 percent of the P needed for corn ethanol. Pesticide use per NEB differs similarly." (Quoted from the National Academy of Sciences recent report titled "Water Implications of Biofuel Production in the United States" at
http://www.nap.edu/catalog.php?record_id=12039 .)

3. Outside the US, and particularly in Europe and in South American major grains and soybean exporters, the liquids fuels usage profile has a much higher share of diesel fuel relative to gasoline, with diesel fuel powering many personal vehicles.

4. Anywhere, diesel fuel's availability is more critical than gasoline's. No gasoline means it will be a pain to get to the supermarket, but no diesel fuel means there will be no goods in the supermarket.

5. Should a shortage of NG develop, most of today's NG-fired power plants can burn diesel fuel as well.

6. Finally, although I don't have a reference at hand to support it, I remember learning that the investment costs for a corn ethanol distillation plant are three times higher than those for a biodiesel plant of similar capacity.

Second, the fact that "the biofuel potential of the entire human food supply is quite a small amount of energy compared to the global oil supply - somewhere between 15-20% on a volumetric basis, so 10-15% on an energy basis -", although conceptually undisputable, is effectively irrelevant. Because the decision about how much agricultural production will be diverted into biofuels will not be made for the whole world by a hypothetical good-willed council that considers the world as one unit and balances the energy and food needs of the world's population. Rather, the decisions will be made by the countries which today are big agricultural exporters taking into account THEIR needs. And the key point here is that the countries with more biofuel production potential (e.g. Brazil, Argentina, Paraguay) have much lower liquid fuel (and energy in general) usage per capita than OECD countries. Therefore if they maximize the allocation of THEIR agricultural potential into biodiesel production (plus sugar cane to ethanol) for THEIR own use, they will be able to keep running the most important parts of THEIR current economies in the face of a future decline of global oil production (and a much harder decline of global oil exports), and it is just not realistic to expect they will forego that possibility.

Since it's essential to understand this issue, I feel it is warranted to emphasize its explanation: even while it's true that, if all vegetable oil in the world were converted to biodiesel, it would only cover 8% of GLOBAL diesel fuel demand, the key point is that Brazilians, Argentinians, etc. will not scale up biodiesel production (from soybean, sunflower or rapeseed, that's not the point) to satisfy GLOBAL diesel fuel demand. They will do it to satisfy THEIR OWN demand. So the relevant analysis that has to be made is, e.g. for Argentina:

- How much land they need to provide wheat, etc. for THEIR OWN population.

- How much biodiesel they would produce if the rest of their arable land were devoted to biodiesel production (pick the oilseed you want).

- How that potential biodiesel production compares to THEIR OWN current diesel fuel consumption.

Basically, if Argentina allocates ALL their current arable land to soybean (currently they allocate 53%), they would generate biodiesel to cover ALL their current diesel fuel consumption. If they used sunflower instead, they would need to allocate only 50% of the current arable land for that (using yield figures from
http://en.wikipedia.org/wiki/Biodiesel). Given that Argentina today is a big grains exporter, it is clear that they can provide food for their current population while at the same time producing enough biodiesel to avoid experiencing a dramatic impact from the coming relentless decline in global crude oil production.

Of course, they will not say as much in their presentations, which can be found at:
http://www.argentine-embassy-uk.org/biofuels/presentaciones/panel1.ppt and
http://www.ars.usda.gov/meetings/Biofuel2007/presentations/IP-B/Almada.pdf .

Therefore the most probable outcome is that, as oil prices go higher, a growing share of agricultural production will be diverted into biodiesel production. Land arbitraging based on profits per acre will drive the allocation of land out of wheat and corn production and into soybean production. Food exports will drop, food prices will rise, and poor people will be priced out of food.

I will try to express the above dynamics as a simple business case. Let's assume a farmer has the option of producing any of the following:

  • Wheat (W)
  • Corn (C)
  • Soybean (S)
  • Soybean Oil (BO) (using a co-owned mill from a local co-op), yielding Soybean Meal (SM) as by-product.
  • Soybean biodiesel (SBD) (further processing BO at a co-owned refinery from a local co-op).

Let's use the suffix "a" to denote "per acre" (non-US folks can use "h" for "per hectare"). Thus, Wa = Wheat yield per acre. Each option yields a different profit per acre. Some key components of profit per acre for W (and C and S) are (the currency is shown as dollar but could be any):

Profit(Wa) =
= $ Wa
- $ fuel (for sowing, harvesting, etc.)
- $ fertilizer, herbicides and pesticides

While the key components of the profit per acre for the full chain of production of soybean biodiesel (SBD) are:

Profit(SBDa) =
= $SBDa
- $ fuel (for sowing, harvesting, etc. the soybean)
- $ fertilizer, herbicides and pesticides
- $ milling operations energy input
+ $SMa by-product
- $ refining operations energy input
- $ methanol
+ $ glycerin by-product

The case for allocating the land to biodiesel production occurs when:

Profit(SBDa) > Max[Profit(Wa), Profit(Ca), Profit(Sa), Profit(BOa)]

Now, since BD (from any oilseed) is functionally equivalent to diesel fuel (DF), except for the fact that the volumetric energy density of BD is about 9 % lower than regular Number 2 petrodiesel (
http://www.biodiesel.org/pdf_files/fuelfactsheets/BTU_Content_Final_Oct2005.pdf) in the absence of any government-induced price distortion (through a difference in taxes/subsidies) the price equivalence condition for any biodiesel to substitute diesel fuel is:

$ BD = 0.9 x $ DF (per gallon/litre)

And, since the prices of most cost items for BD are more or less directly linked to the prices of fossil fuels (including methanol, which is currently made out of coal in China, waste in Germany, and NG elsewhere, according to
http://www.methanol.org/pdf/WorldMethanolPlantsEndOf2006.pdf), which most probably will all rise along with the price of crude oil, though at different speeds, then Profit(BDa) will rise with the crude oil price in, at the very least, a roughly directly proportional fashion. In contrast, for W (and C, etc.) the oil price has an impact only on the cost items. Therefore, the higher the crude oil price, the higher Profit(BDa) and the lower Profit(Wa), Profit(Ca), etc.

At this point, arbitraging starts. As more land is diverted into BD production and less into grains, BD production will increase and its price will stabilize (I wouldn't say fall) while grains production will decrease and their prices will rise, until Profit(Wa) becomes competitive with Profit(BDa) and no further land is diverted into BD. However, since the prospects for world crude oil production is to experience a relentless decline after its near (2012?) peak, if demand for crude oil does not fall correspondingly on its own, crude oil (and diesel fuel) prices will keep rising, having a further diverging impact on Profit(BDa) and Profit(Wa), etc., and driving the land arbitraging mechanism to successive new equilibrium states with more land allocated to BD and less land to grains.

Therefore, in the absence of a worldwide voluntary reduction of crude oil demand in line with the evolution of crude oil production (as proposed by the Oil Depletion Protocol), the prospects for world food production are quite bleak.

A similar analysis as that for soybean biodiesel can be made for corn ethanol, the main difference being that the energy and fertilizer, etc. costs are so much higher for corn ethanol that it wouldn't yield a profit in the absence of huge government subsidies. Similar analyses can also be made for sunflower biodiesel and rapeseed biodiesel. These options have on the one hand the advantage of higher oil and biodiesel yields per acre/hectare, and on the other the disadvantage of lacking a by-product of significant nutritional value as livestock and poultry feed as Soybean Meal.

Now it could be useful to refine a bit the expression of the business case.

As said above, Profit(BD) refers to the profit for the full production chain, because full vertical integration was being assumed (i.e. farmers owned the mill and the refinery through a co-op). Even if there were no such integration, it still makes sense to look at the profit for the full chain because it has to be higher than that for just producing soybeans. But it might be more useful to separate the profits for each stage, e.g. for soybeans:

- Farming - Output: soybeans (S)
- Milling and oil refining - Input: S; Output: Soybean oil (BO) + Soybean Meal (SM)
- Transesterification - Input: BO; Output: SBD

Thus, the profit for the full chain can be expressed as:

Profit(SBD) =
= Profit(S)
+ Profit(BOmill)
+ Profit(SBDref)

For prices, it is necessary to specify whether they are retail or collected by the refiner, the difference being taxes (ignoring gas station margin by assuming that gas station profitability is the same for biodiesel and diesel fuel). Because the price equivalence condition with diesel fuel (DF) holds at the retail level. Therefore, for ANY biodiesel:

$BDretail = 0.9 x $DFretail

$BDref + $BDtax = 0.9 x ($DFref + $DFtax)

$BDref = 0.9 x ($DFref + $DFtax) - $BDtax

For corn ethanol, the price equivalence condition with gasoline (RB) would be:
$CEref = 0.66 x ($RBref + $RBtax) - $CEtax

Clearly, the business case for a biofuel is heavily dependent on both the tax/subsidy on the biofuel itself and the tax/subsidy on the substituted petroleum product (subsidy being a negative tax), so that if the petroleum product has a higher tax/lower subsidy than the biofuel the business case is improved. The level of taxation/subsidising on petroleum products varies wildly across different countries, as shown in the "International Fuel Prices 2007" document available from http://www.gtz.de/en/themen/umwelt-infrastruktur/transport/10285.htm .

It should be noted, however, that the case for biofuel production in a country does not necessarily arise out of the price equivalence condition holding in the producing country, because the biofuel can be produced for exporting to another country where the condition holds. Thus, while in November 2006 retail diesel prices in Argentina ($0.48 per litre) or even Brazil ($0.84) would not make the case for biodiesel production for local use, retail diesel prices for France ($1.33), Germany ($1.38), Italy ($1.49) and the UK($1.73) would paint a different picture for exports. And that was in November 2006, with a WTI price of $60. So it is reasonable to assume that the scaling up of biodiesel production will initially be driven by exports and only later - as domestic crude oil production declines significantly - be diverted to supply the local market. This prospect is supported, at least for Argentina, by an excellent study on their biofuels market available at
http://www.biodiesel.com.ar/download/emerging_liquid_biofuel_markets.pdf

Therefore, using the price collected by the biodiesel refiner, the profit for the transesterification stage is, for soybeans:

Profit(SBDref) =
= $BDref
- $BOmill
- $ refining operations energy input
- $ methanol
+ $ glycerin by-product

The profit formula uses $BOmill and not $BOretail because typically the owner of the milling and oil refining facility also owns the biodiesel refinery. So the profit is related to the price they get for BO, which is its cost for the transesterification stage.

It should be noted that the difference in profits for the transesterification stage using different vegetable oils as feedstock depends only on the price of the vegetable oils. However, this should not be expected to lead to instantaneous arbitration between oilseeds. Because, in contrast with transesterification facilities which can equally process any vegetable oil, milling facilities are specific for each oilseed. Therefore, oilseed arbitration would depend on the combination of Profit(*OILmill) + Profit(*BDref).

2008-01-02

Oil and food 2007 milestones and 2008 prospects

For crude oil, the 2007 milestone could best be described as "the third straight year of practically stagnant supply in the face of higher demand (and prices)."

This comes from both
EIA data as of Jan. 08, 2008 at
http://www.eia.doe.gov/emeu/steo/pub/contents.html (table 3a), and
IEA data as of Dec. 14, 2007 at
http://omrpublic.iea.org/currentissues/full.pdf.

World oil production
year 2005 2006 2007 2008
EIA 84.6 84.6 84.8 87.6 (wishful thinking?)
IEA 84.6 85.4 85.5

World oil consumption
year 2005 2006 2007 2008
EIA 83.7 84.8 85.9 87.5
IEA 83.9 84.7 85.7 87.8

Clearly 2008 will be "interesting times" in the Chinese sense for the oil market, since, for the {EIA IEA}, projected 2008 global demand will be {2.7 2.3} Mpbd higher than 2007 global supply (*). So,
  • either world oil production experiences a "surge" in 2008 (do you feel lucky?),
  • or a good recession is allowed to take place in the OECD,
  • or the oil price will surge deep into the triple digits in 2008 (and not only in dollars).

(*) The trend in EIA projections is in fact for worse, since as of Dec. 11, 2007 they were also predicting 2008 demand "only" 2.3 Mbpd higher than 2007 supply.

For food, the 2007 milestone is best described by the FAO in their November 2007 Food Outlook at http://www.fao.org/docrep/010/ah876e/ah876e00.htm

"The FAO food price index ... in September 2007 ... stood at 172 points, representing a year-on-year jump in value of roughly 37 percent. The surge in prices has been led primarily by dairy and grains, but prices of other commodities, with the exception of sugar, have also increased significantly.

... What distinguishes the current state of agricultural markets is rather the concurrence of the hike in world prices of, not just a selected few, but of nearly all, major food and feed commodities. As has become evident in recent months, high international prices for food crops such as grains continue to ripple through the food value/supply chain, contributing to a rise in retail prices of such basic foods as bread or pasta, meat and milk. Rarely has the world felt such a widespread and commonly shared concern about food price inflation, a fear which is fuelling debates about the future direction of agricultural commodity prices in importing as well as exporting countries, be they rich or poor."

And the linked Market summaries page (.../ah876e01.htm) adds, for cereals:

"For most cereals, supplies are much tighter than in recent years while demand is rising for food as well as feed and industrial use. Stocks, which were already low at the start of the season, are likely to remain equally low because global cereal production may only be sufficient to meet expected world utilization. International prices of cereal have risen, fuelling domestic food price inflation in many parts of the world. Trade is expected to contract because of high and volatile prices, coupled with soaring freight rates."

Therefore, price action for wheat, rice and soybeans as well as the evolution of global cereal stocks (dropped to 428 Mt for 2006/2007) look like important milestones to include.

Particularly since, from the December 17 FAO communique at
http://www.fao.org/newsroom/en/news/2007/1000733/index.html

"FAO is urging governments and the international community to implement immediate measures in support of poor countries hit hard by dramatic food price increases. Currently 37 countries worldwide are facing food crises due to conflict and disasters. In addition, food security is being adversely affected by unprecedented price hikes for basic food, driven by historically low food stocks, droughts and floods linked to climate change, high oil prices and growing demand for bio-fuels. High international cereal prices have already sparked food riots in several countries."